Abstract
The performance of three filtering facepiece respirators (two models of N99 and one N95) challenged with an inert aerosol (NaCl) and three virus aerosols (enterobacteriophages MS2 and T4 and Bacillus subtilis phage)-all with significant ultrafine components-was examined using a manikin-based protocol with respirators sealed on manikins. Three inhalation flow rates, 30, 85, and 150 l min(-1), were tested. The filter penetration and the quality factor were determined. Between-respirator and within-respirator comparisons of penetration values were performed. At the most penetrating particle size (MPPS), >3% of MS2 virions penetrated through filters of both N99 models at an inhalation flow rate of 85 l min(-1). Inhalation airflow had a significant effect upon particle penetration through the tested respirator filters. The filter quality factor was found suitable for making relative performance comparisons. The MPPS for challenge aerosols was <0.1 mum in electrical mobility diameter for all tested respirators. Mean particle penetration (by count) was significantly increased when the size fraction of <0.1 mum was included as compared to particles >0.1 mum. The filtration performance of the N95 respirator approached that of the two models of N99 over the range of particle sizes tested ( approximately 0.02 to 0.5 mum). Filter penetration of the tested biological aerosols did not exceed that of inert NaCl aerosol. The results suggest that inert NaCl aerosols may generally be appropriate for modeling filter penetration of similarly sized virions.
Figures
FIGURE 1.
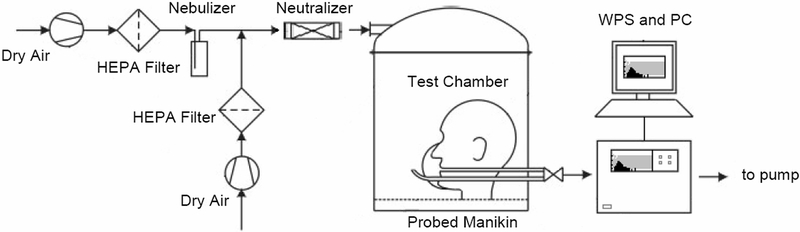
Filter penetration test system. Diagram adapted from Balazy et al. (2006a,b).
FIGURE 2.
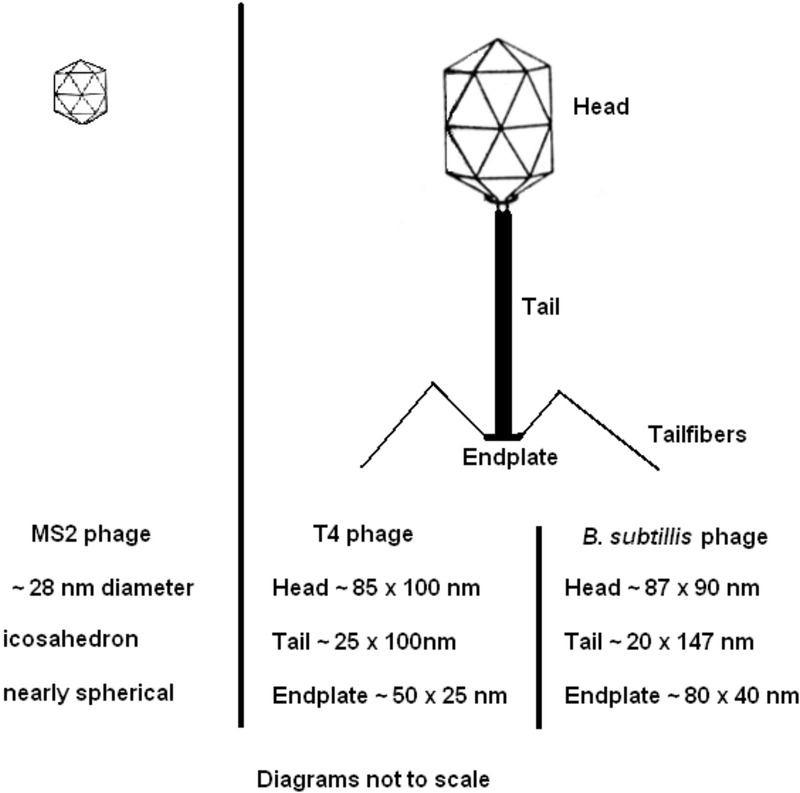
Shape and dimensions of the bacteriophages used in this study.
FIGURE 3.
Filter penetration test system. Diagram adapted from Balazy et al. (2006a,b).
FIGURE 4.
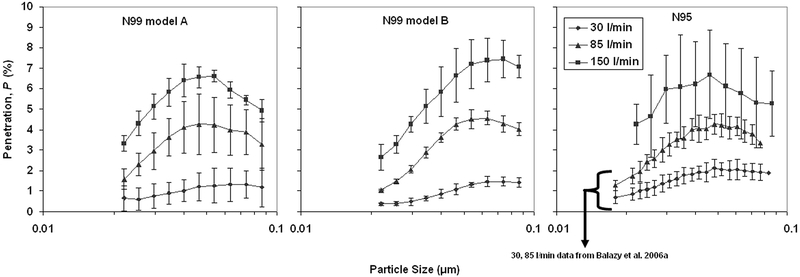
Aerosol penetration through three respirators as a function of the particle size and inhalation flow rate for MS2 bacteriophage challenge aerosol.
FIGURE 5.
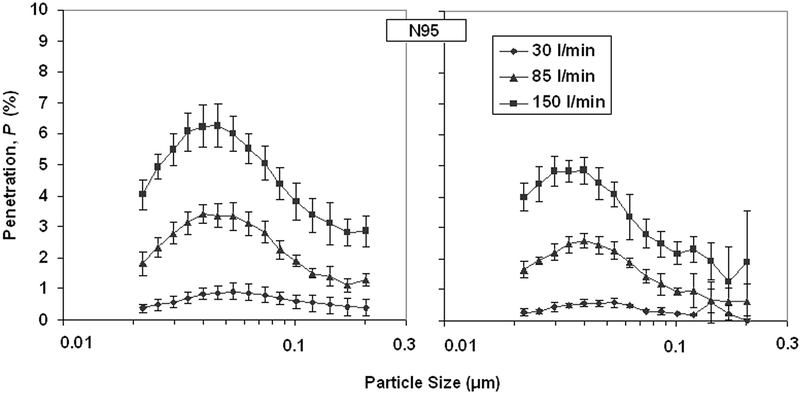
Aerosol penetration through N95 respirator as a function of the particle size and inhalation flow rate for two challenge viruses: B. subtilis bacteriophage (left) and T4 bacteriophage (right).
FIGURE 6.
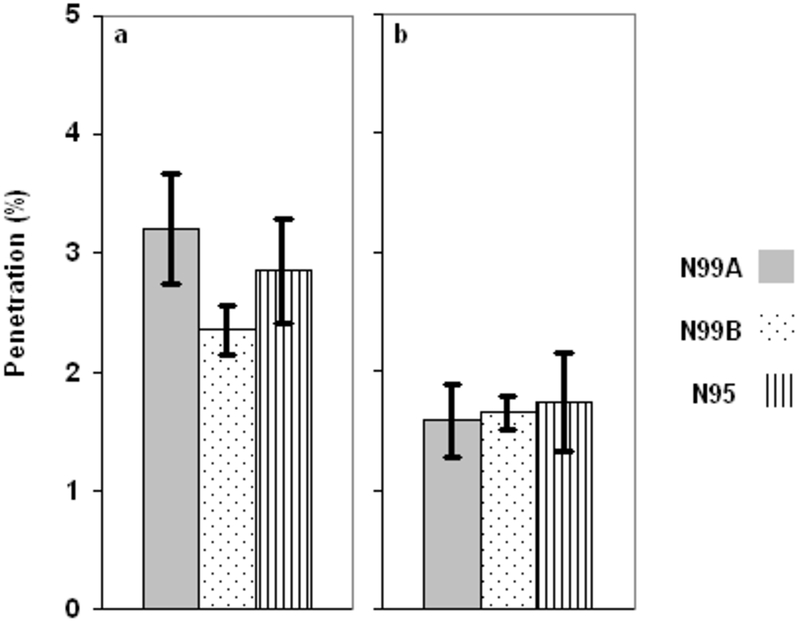
Between respirator comparison: mean penetration of NaCl [integrated for the size range of 0.02–0.5 μm (a), and 0.1–0.5 μm (b)] at 85 L/min.
FIGURE 7.
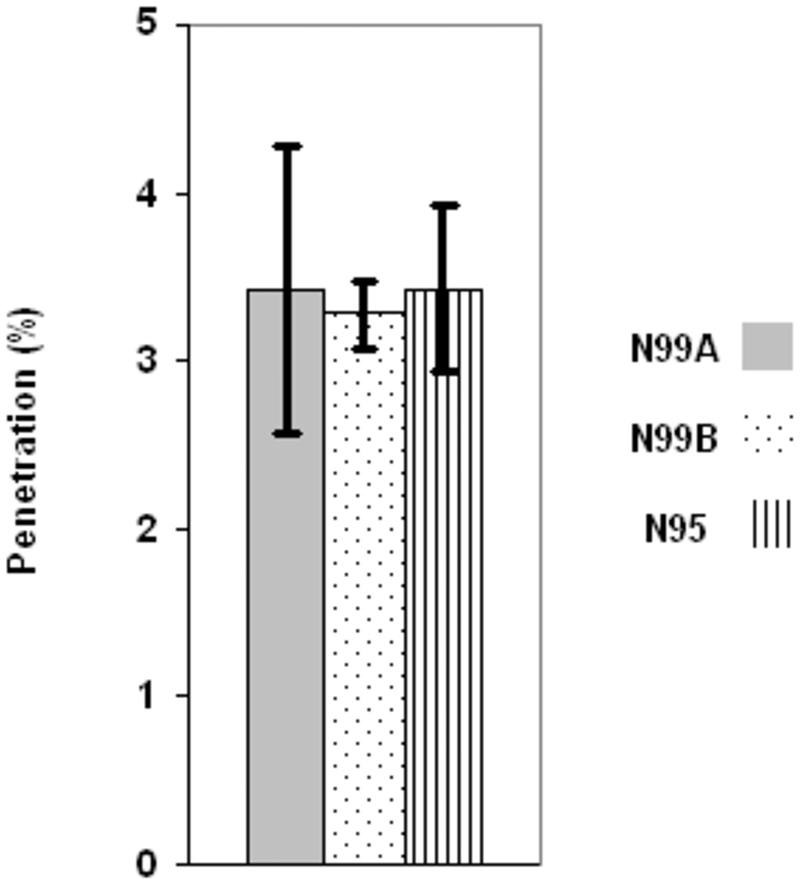
Between respirator comparison: mean penetration of MS2 (integrated for the size range of 0.02 – 0.09 μm) at 85 L/min.
FIGURE 8.
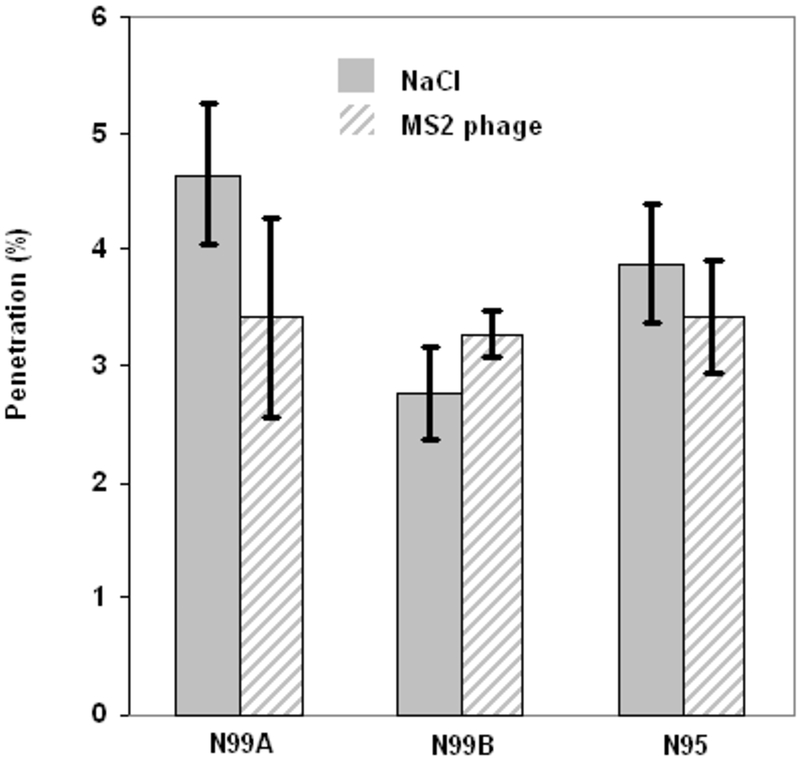
Within respirator comparison: mean penetration of NaCl and MS2 (integrated for the size range of 0.02 – 0.09 μm) at 85 L/min.
FIGURE 9.
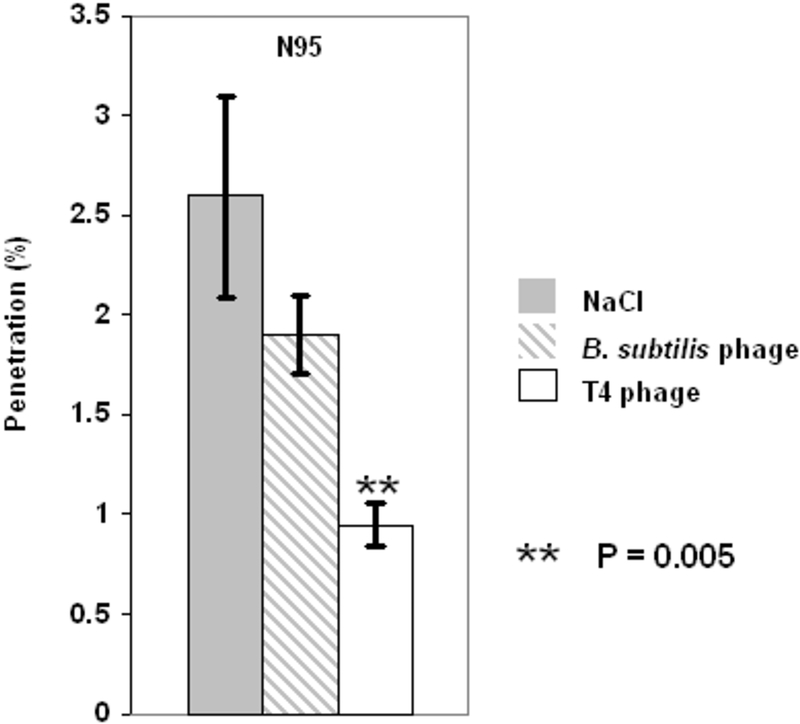
Within respirator comparison for N95 at 85 L/min: mean penetration of NaCl compared to B. subtilis phage and T4 phage at 0.1 μm.
FFIGU