Reliable information has never been more critical than it is during our current public health crisis. And while most Americans have remained glued to their cable news outlet of choice to find out the latest about the coronavirus outbreak, there are a number of trustworthy, nonpartisan websites providing up-to-date COVID-19 numbers that you can access around the clock. Whether you are interested in the latest hotspots, flattening the curve, or the projected number of ventilators needed in comparison with the number of projected cases, there’s a COVID-19 tracker for you to bookmark. Read on for the best of the best. And if you’re interested in past data, check out: How Does Coronavirus Stack Up Compared to Other Pandemics?
- The Financial Times coronavirus updates
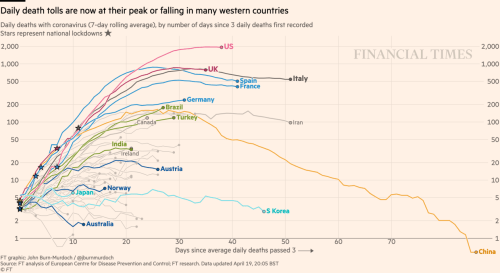
The Financial Times is usually paywall protected, but they have made their coronavirus coverage free and available to everyone during this global pandemic. Largely focused on global coverage, the Financial Times produces a daily chart that tracks the exponential curves of death tolls by nation, which fortunately, have been largely flattening lately. They also publish charts that feature the spread of the virus by nation, urban area, and hotspot. And for more uplifting facts to focus on, check out 5 Uplifting Coronavirus Facts to Bring Optimism Back into Your Life.
2. Google’s coronavirus tracker
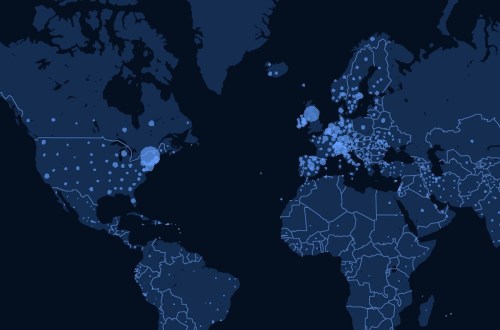
Of course, you likely already know to Google the coronavirus information you may be seeking, but you may not know that Google itself has become a handy repository for all sorts of COVID-19-related information. Google even has a dedicated COVID-19 page that features location-specific maps and data.
3. The HealthData COVID-19 tracker

Perhaps the least known, but most useful resource is put forth by Healthdata, a site managed by the Institute for Health Metrics and Evaluation (IHME), an independent population health research center at UW Medicine, part of the University of Washington. IMHE is behind a recent report that effectively estimates when states can expect to see the end of the coronavirus-related lockdown. The site also provides daily updates to the “curve” with unique insights into the projected ventilator, ICU, and hospital bed needs in comparison with the number of expected cases. And for more data from the IHME, check out Here’s When Your State’s Lockdown Is Expected to Start to Lift.
4. Johns Hopkins coronavirus tracker
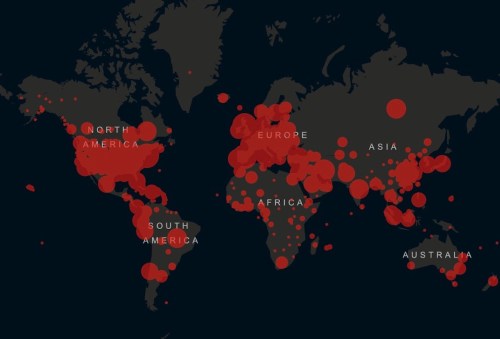
Johns Hopkins Medical Center is the primary source for the ubiquitous coronavirus pandemic numbers you see emblazoned on cable news (particularly CNN). The super well-funded research center was first to get ahead of the data game on which so much of COVID-19-related projects rely. The site provides critical statistical trends, updates, and findings. So you don’t have to wait for your nightly cable news program to come on to see the latest numbers.
5. COVID Act Now
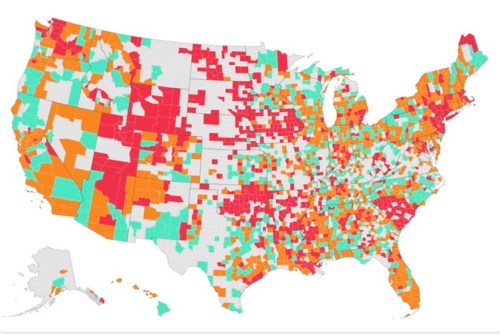
COVID Act Now was “started by four volunteers who saw the explosive and deadly growth of COVID infections around the world and felt they had to do something.” They’ve since partnered with some of “America’s preeminent epidemiologists and data scientists to develop the U.S. Interventions Model.”
The U.S. Interventions Model is the key feature of COVID Act Now, a data platform that projects COVID infections, hospitalizations, and deaths across the United States. The data is designed to help decision-makers understand when and how COVID will affect their communities so that they can be proactive.
6. The COVID Tracking Project
The COVID Tracking Project describes itself as “a volunteer organization launched from The Atlantic” that’s “dedicated to collecting and publishing the data required to understand the COVID-19 outbreak in the United States.” Since launching in early Mar. 2020, they have become a team of hundreds of volunteer data-gatherers, developers, scientists, reporters, designers, editors, and other dedicated contributors. The site’s key feature is data collected on COVID-19 testing and patient outcomes from all 50 states, five territories, and the District of Columbia.
7. Rt COVID-19
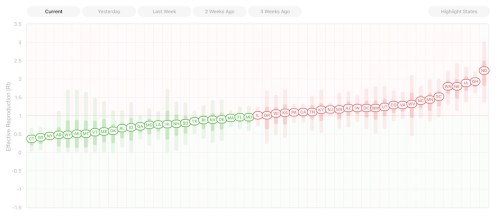
Created by Instagram co-founders Kevin Systrom and Mike Krieger, Rt.live is an up-to-date tracker of how fast COVID-19 is spreading in each state. The site focuses on up-to-date values for something called Rt, “the average number of people who become infected by an infectious person.” According to the site, if Rt is above 1.0, the virus will spread quickly; when Rt is below 1.0, the virus will stop spreading. And for more COVID-19 numbers to pay attention to, check out How Flu Deaths and Other Common Killers Compare With Coronavirus.