Abstract
The aim of this study was to investigate respirator filter and faceseal penetration of particles representing bacterial and fungal spore size ranges (0.7-4 mum). First, field experiments were conducted to determine workplace protection factors (WPFs) for a typical N95 filtering facepiece respirator (FFR). These data (average WPF = 515) were then used to position the FFR on a manikin to simulate realistic donning conditions for laboratory experiments. Filter penetration was also measured after the FFR was fully sealed on the manikin face. This value was deducted from the total penetration (obtained from tests with the partially sealed FFR) to determine the faceseal penetration. All manikin experiments were repeated using three sinusoidal breathing flow patterns corresponding to mean inspiratory flow rates of 15, 30, and 85 l min(-1). The faceseal penetration varied from 0.1 to 1.1% and decreased with increasing particle size (P < 0.001) and breathing rate (P < 0.001). The fractions of aerosols penetrating through the faceseal leakage varied from 0.66 to 0.94. In conclusion, even for a well-fitting FFR respirator, most particle penetration occurs through faceseal leakage, which varies with breathing flow rate and particle size.
Figures
FUGURE 1.
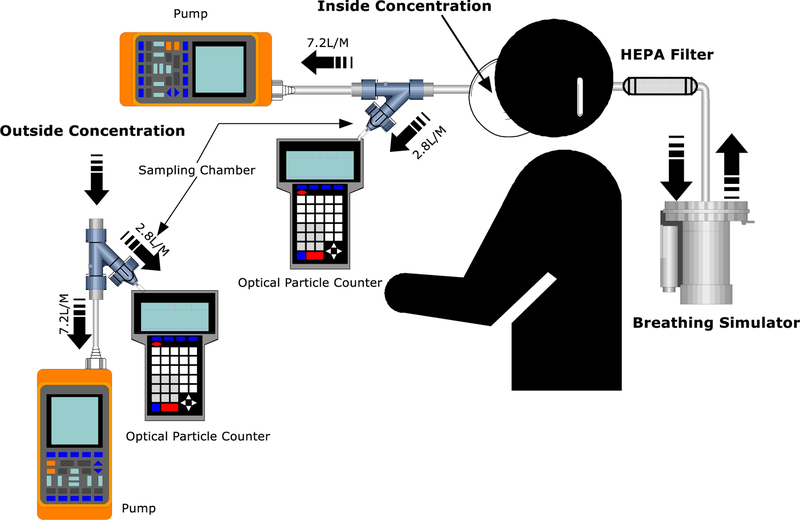
Experimental set-up for manikin-based testing of particle penetration through filter and face seal leakage.
FIGURE 2.
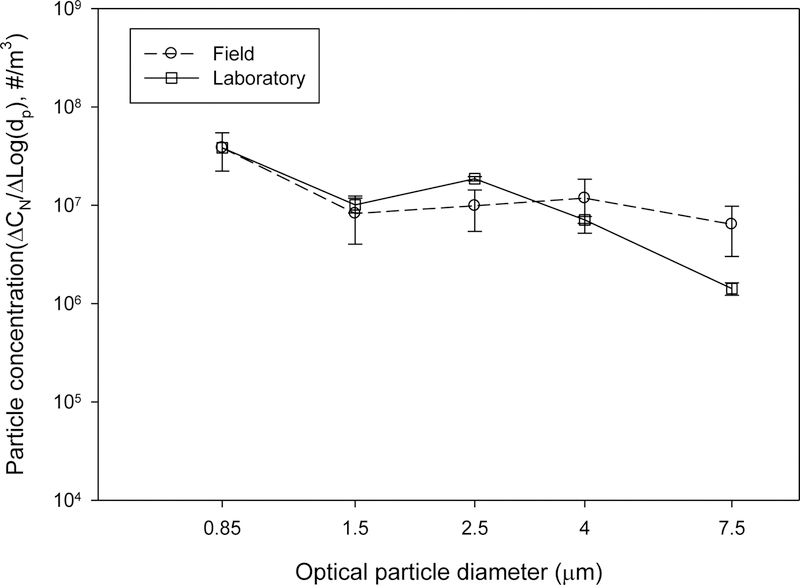
Mean of outside concentration in four field experiments and in all laboratory experiments. The concentration in the laboratory was averaged over all laboratory experiments (completely sealed and partially sealed respirator tested under three respiration flow rates), and the concentration in the field was averaged from four agricultural farms where WPF was measured for 13 human subjects. The symbols present means, and error bars present 95% confidence intervals.
FIGURE 3.
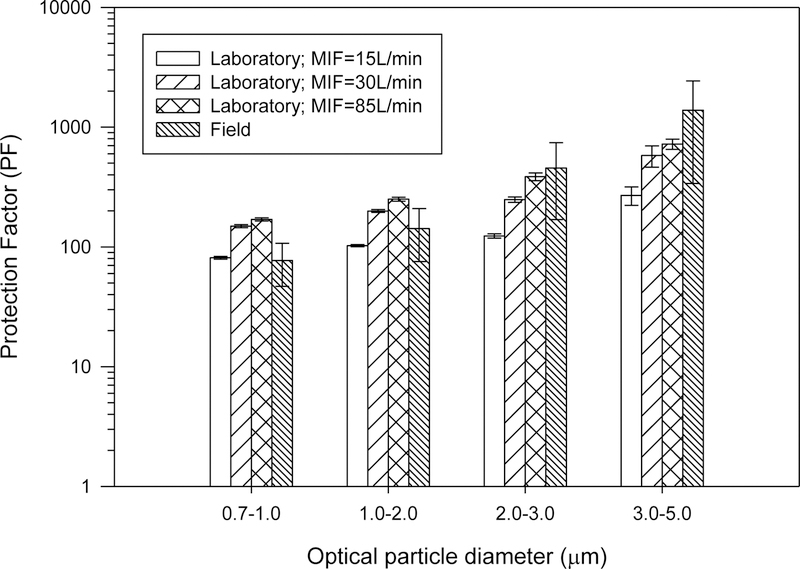
WPF measured in the field for 13 agricultural workers and in the laboratory for three different Mean Inspiration Flow (MIF) cyclic breathing rates under partially sealed condition. The histograms present means, and error bars present 95% confidence intervals.
FIGURE 4.
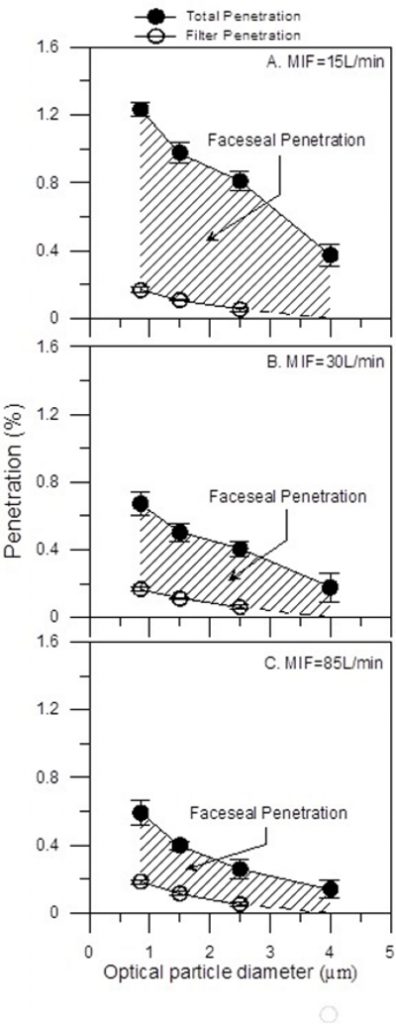
Comparison of total penetration, filter penetration and face seal penetration at three different Mean Inspiratory Flow (MIF) breathing rates. The symbols present means, and error bars present 95% confidence intervals.
FIGURE 5.
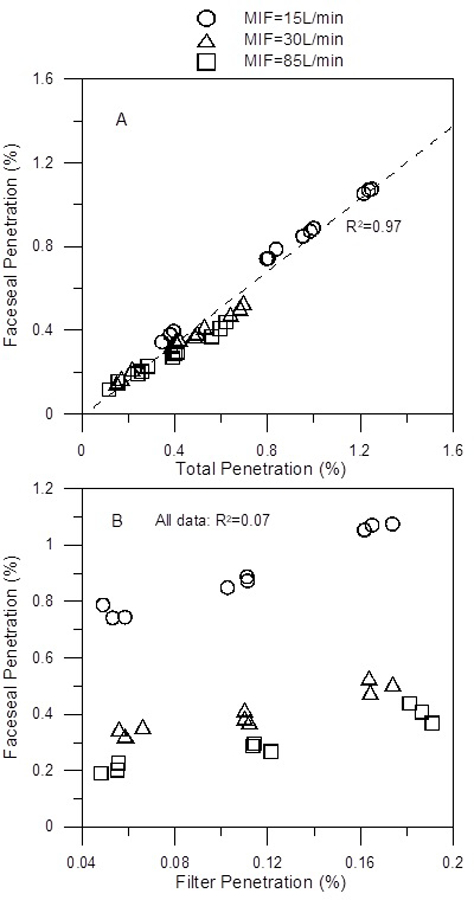
Correlation between faceseal penetration and total penetration (A) and between faceseal penetration and filter penetration (B).