Genome mapping is used to identify and record the location of genes and the distances between genes on a chromosome. Genome mapping provided a critical starting point for the Human Genome Project.
- A genome map highlights the key ‘landmarks’ in an organism’s genome?.
- A bit like how the London tube map shows the different stops on a tube line to help you get around the city, a genome map helps scientists to navigate their way around the genome.
- The landmarks on a genome map may include short DNA?sequences, regulatory sites that turn genes? on and off or the genes themselves.
- Genome mapping provided the basis for whole genome sequencing? and the Human Genome Project?.
- Sequenced DNA fragments can be aligned to the genome map to aid with the assembly of the genome.
- Over time, as scientists learn more about a particular genome, its map becomes more accurate and detailed. A genome map is not a final product, but work in progress.
Different types of genome mapping
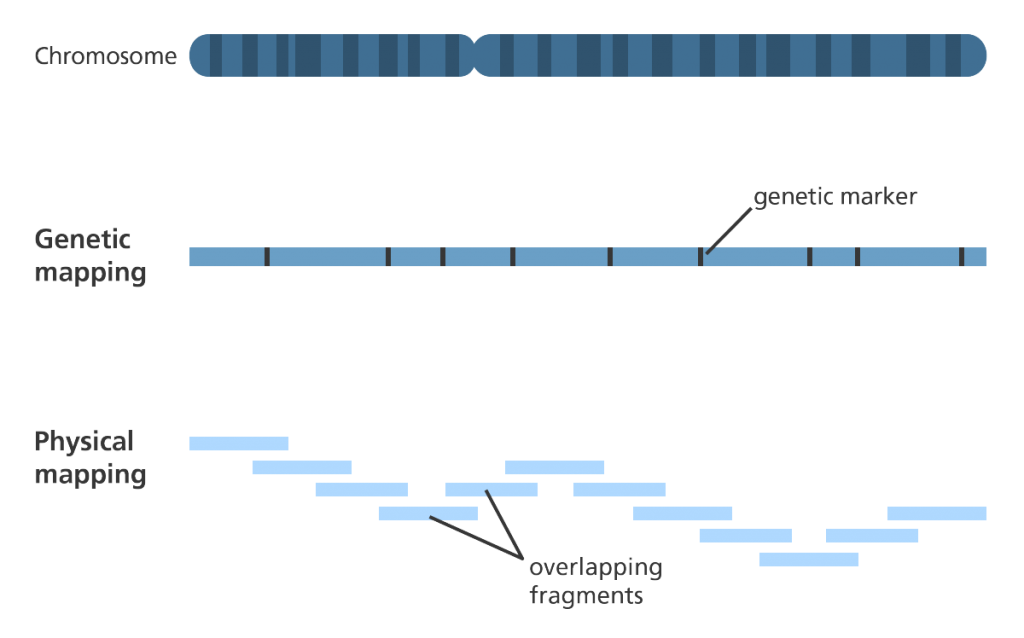
- There are two general types of genome mapping called genetic mapping and physical mapping.
- Both types of genome mapping guide scientists towards the location of a gene (or section of DNA) on a chromosome?, however, they rely on very different information.
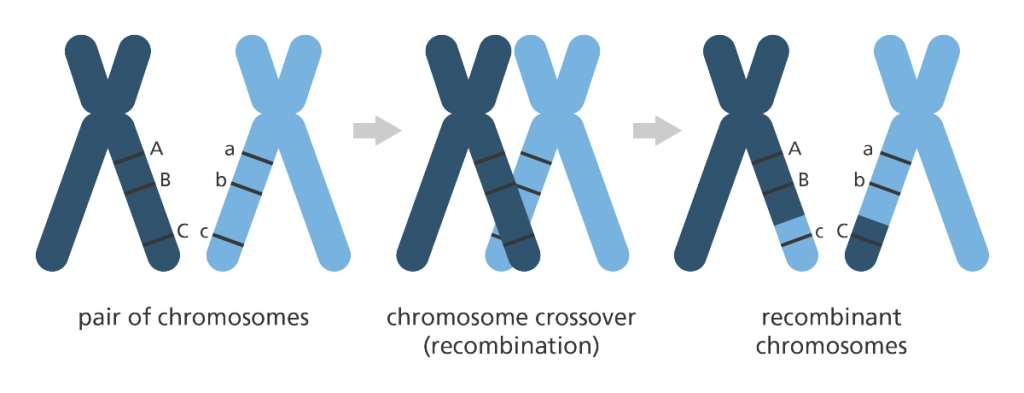
- Genetic mapping looks at how genetic information is shuffled between chromosomes or between different regions in the same chromosome during meiosis? (a type of cell division). A process called recombination or ‘crossing over’.
- Physical mapping looks at the physical distance between known DNA sequences (including genes) by working out the number of base pairs? (A-T, C-G) between them.
Genetic mapping
Early genetic maps
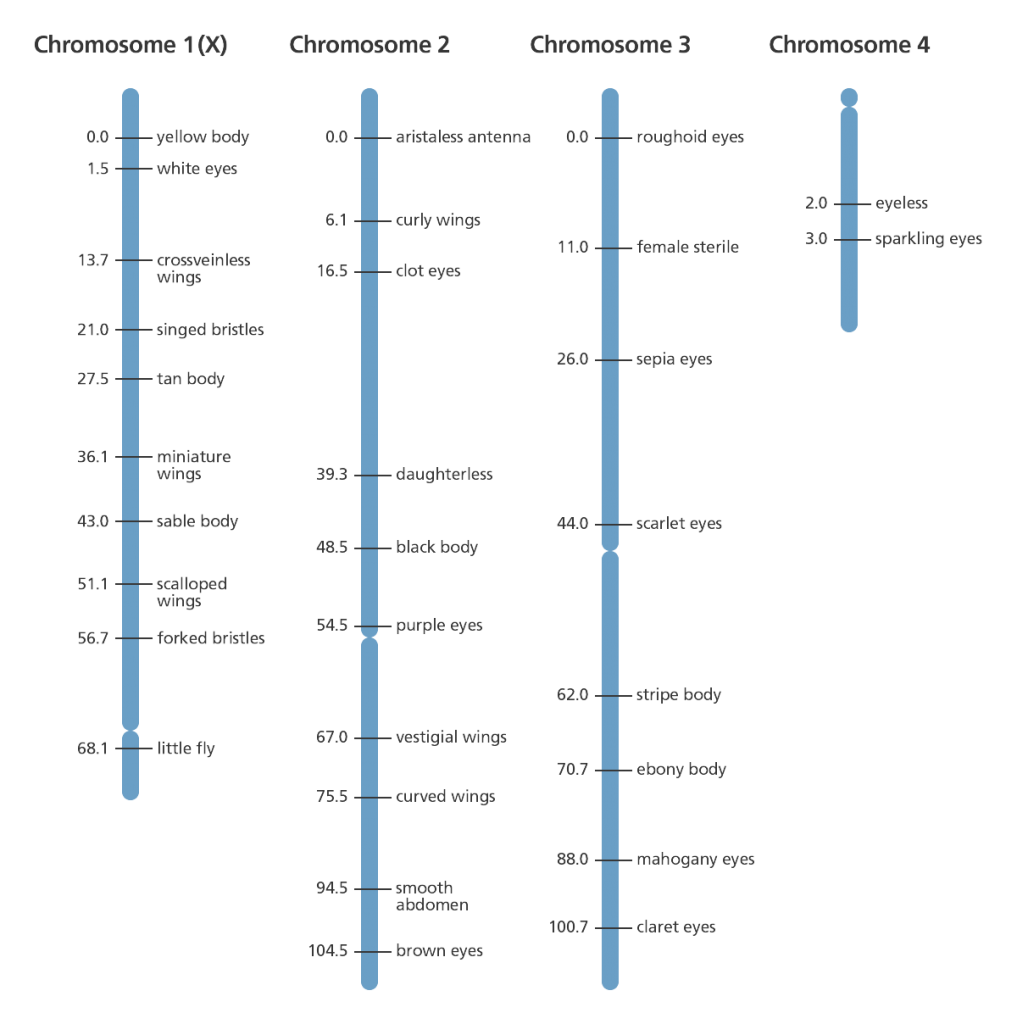
- Alfred Sturtevant created the first genetic map of a chromosome from the fruit fly (Drosophila melanogaster) in 1913.
- He determined that genes were arranged on chromosomes in a linear way, like beads on a necklace, and that genes for specific traits? are located in particular places.
- He proposed that the frequency of ‘crossing over’ (recombination) between two genes could help determine their location on a chromosome.
- He realised that genes that were far apart on a chromosome are more likely to be inherited separately simply because there is a larger region over which recombination can occur.
- In the same way, genes that are close to each other on the chromosome are more likely to be inherited together.
- By finding out how often various characteristics are inherited together it is possible to estimate the distance between the genes. A map of where the genes are in relationship to each other on the chromosomes can then be drawn. This is called a linkage map.
- Genes that are on the same chromosome are said to be ‘linked’ and the distance between these genes is called a ‘linkage distance’. The smaller the distance the more likely two genes will be inherited together.
- The same concept of studying how traits are passed on was applied to develop the first human genome map.
- If two (or more) characteristics were seen to be frequently inherited together in a family, for example blonde hair and blue eyes, it suggested that the genes for the two characteristics were close together on a particular chromosome.
Modern genetic maps
- With more recent genetic mapping techniques, the position of genes is worked out from finding the exact frequency of genetic recombination that has occurred.
- To produce a genetic map, researchers collect blood or tissue samples from members of a family, some of whom have a certain disease or characteristic.
- The researchers then isolate the DNA from samples taken from each individual and closely examine it to find unique patterns in the DNA of those individuals with the disease/characteristic, that aren’t present in the DNA of the individuals who don’t have the disease/characteristic.
- These are referred to as markers and are extremely valuable for tracking inheritance of characteristics or diseases through several generations of a family.
- One type of DNA marker?, called a microsatellite, is found throughout the genome and consists of a specific repeated sequence of bases.
- If a particular gene is close to a DNA marker on the chromosome, it is more likely that the gene and marker will stay together during the recombination process and are therefore more likely to be passed down along the family line (inherited) together.
- In the same way, if a DNA marker and gene are frequently separated by the recombination process it suggests that they are far apart on the chromosome and are less likely to be inherited together.
- The more DNA markers there are on a genetic map the more likely it is that one of them will be located close to the disease or trait-associated gene.
- While genetic maps are good at giving you the bigger picture, they have limited accuracy and therefore need to be supplemented with further information gained from other mapping techniques, such as physical mapping.
Physical mapping
- Physical mapping gives an estimation of the (physical) distance between specific known DNA sequences on a chromosome.
- The distance between these known DNA sequences on a chromosome is expressed as the number of base pairs between them.
- There are a several different techniques used for physical mapping. These include:
- Restriction mapping (fingerprint mapping and optical mapping)
- Fluorescent in situ hybridisation (FISH) mapping
- Sequence tagged site (STS) mapping.
Restriction mapping
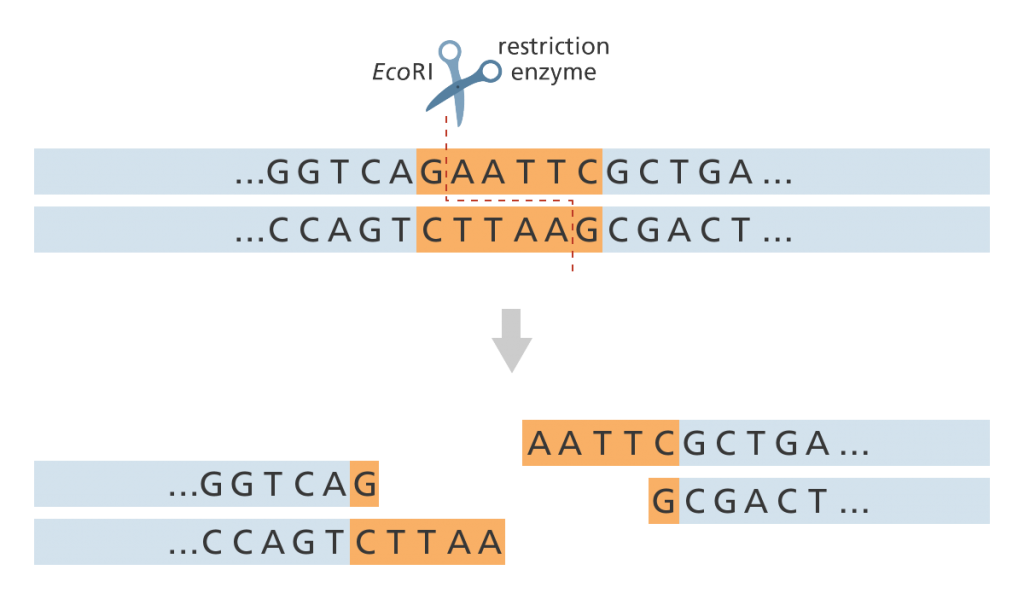
- This uses specific restriction enzymes? to cut an unknown segment of DNA at short, known base sequences called restriction sites.
- Restriction enzymes always cut DNA at a specific sequence of DNA (restriction site). For example, the restriction enzyme EcoRI (taken from Escherichia coli?) always cuts at the sequence GAATTC/CTTAAG. Therefore if we use EcoRI to cut the DNA we know that the DNA sequence either side of the cut will be AATT (see figure below).
- A restriction map shows all the locations of that particular restriction site (GAATTC) throughout the genome.
- A physical map is generated by aligning the different restriction maps along the chromosomes.
- There a two specific types of restriction mapping – optical and fingerprint.
Fingerprint mapping
- In fingerprint mapping the genome is broken into fragments which are then copied in bacteria? cells?.
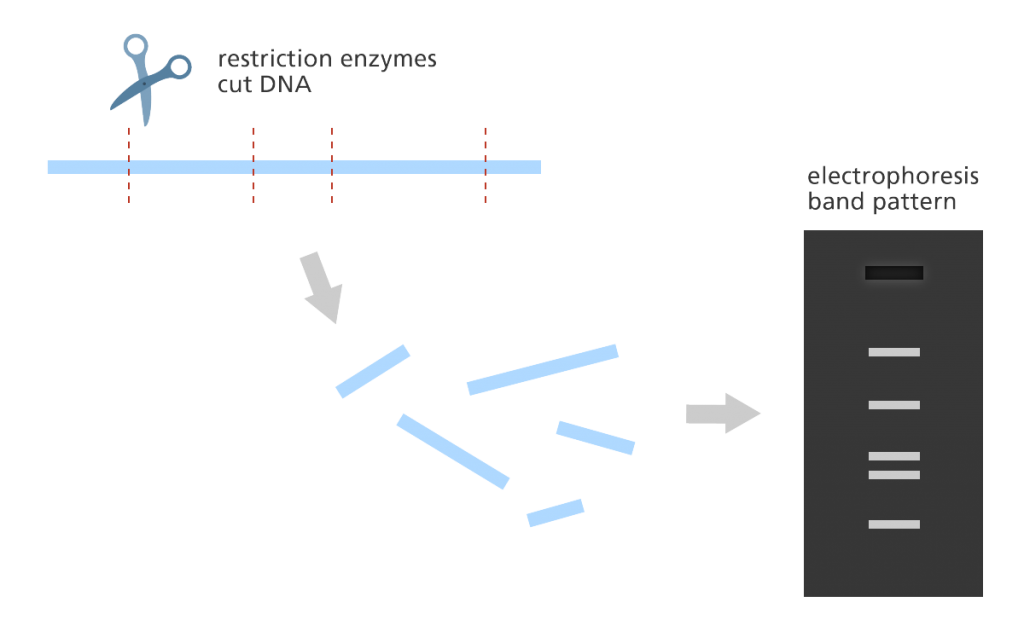
- The DNA copies (clones) are then cut by restriction enzymes and the lengths of the resulting fragments are estimated using a lab method called electrophoresis?.
- Electrophoresis separates the fragments of DNA according to size resulting in a distinct banding pattern.
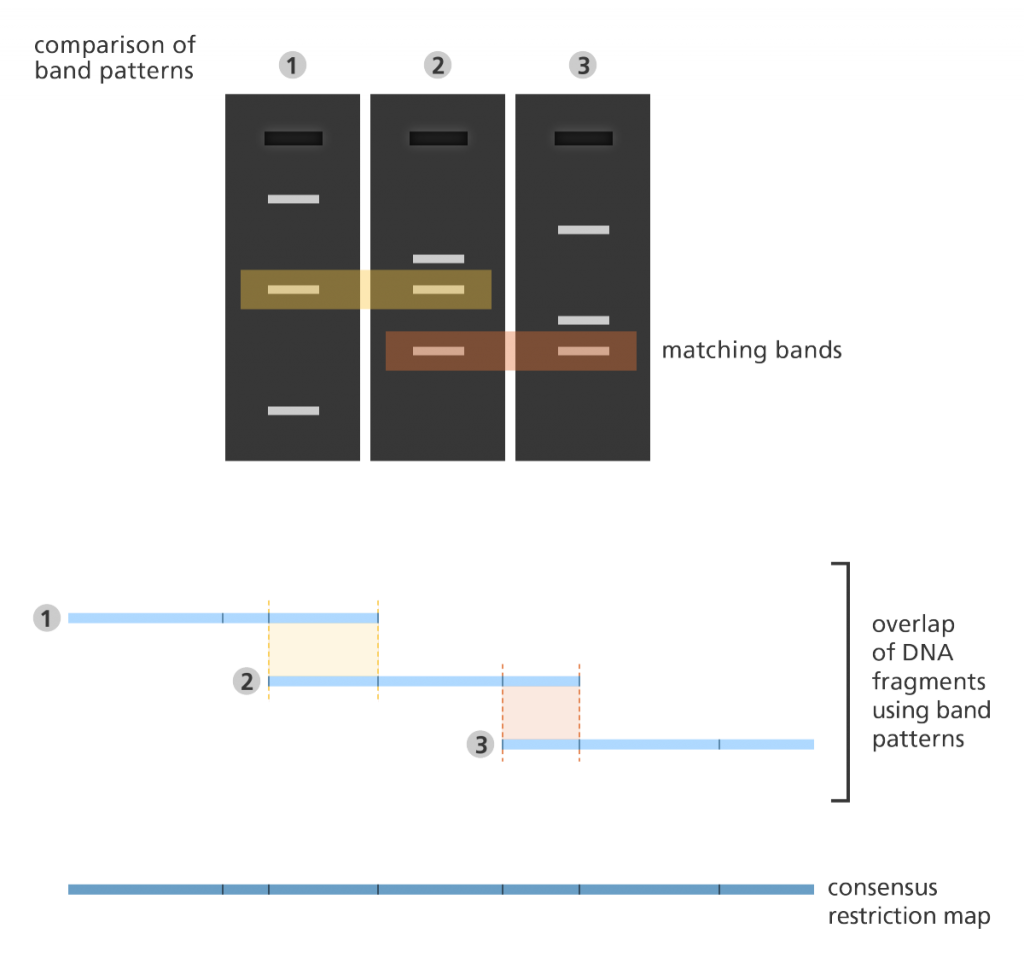
- The fingerprint map is constructed by comparing the patterns from all the fragments of DNA to find areas of similarity. Those with similar patterns are then grouped together to form a map.
- Fingerprint mapping formed the basis to the sequencing of the human, mouse, zebrafish and pig genomes.
Optical mapping
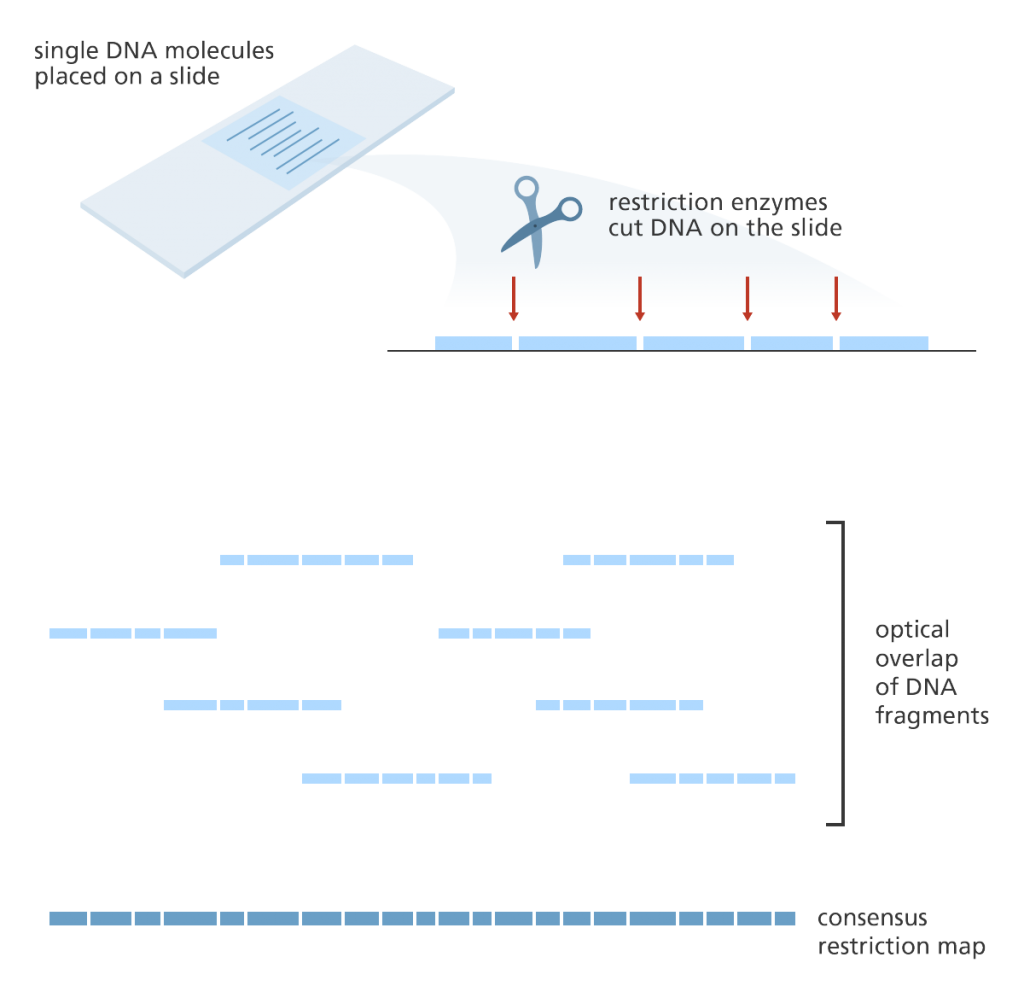
- Optical mapping uses single molecules of DNA that are stretched and held in place on a slide.
- Restriction enzymes are added to cut the DNA at specific points leaving gaps behind.
- The fragments are then stained with dye and the gaps are visualised under a fluorescence? microscope.
- The intensity of the fluorescence is used to construct an optical map of single molecules.
- These can then be combined and overlapped to give a global overview of the genome and aid with assembling a sequenced genome.
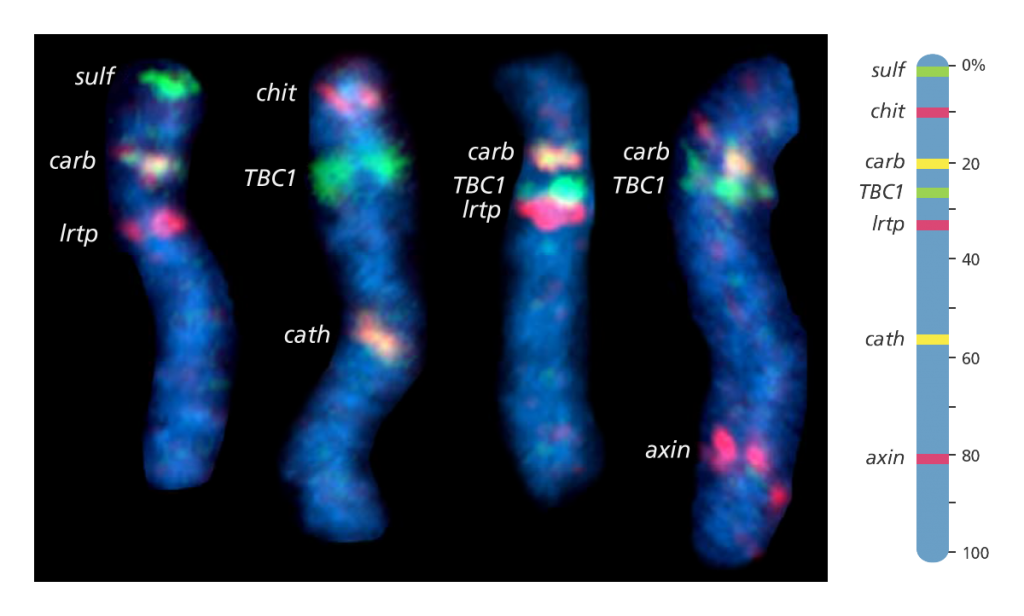
Fluorescent in situ hybridisation (FISH) mapping
- This uses fluorescent probes to detect the location of DNA sequences on chromosomes.
- First, the probes are prepared. These are short sequences of single-stranded DNA, that match the DNA sequence that the scientist wants to find.
- The probes are then labelled with fluorescent dye before being mixed with the chromosome DNA so that it can bind to a complementary strand of DNA on the chromosome.
- The fluorescent tag allows the scientist to see the location of the DNA sequence on the chromosome.
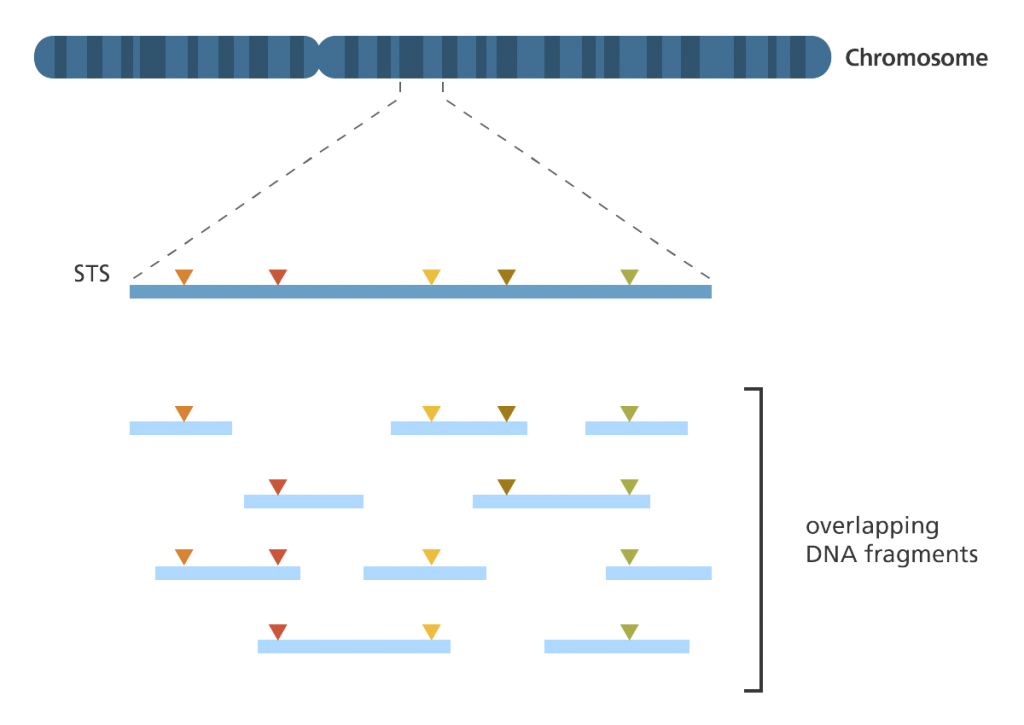
Sequence-tagged site (STS) mapping
- This technique maps the positions of short DNA sequences (between 200-500 base pairs in length) that are easily recognisable and only occur once in the genome. These short DNA sequences are called sequence-tagged sites (STSs).
- To map a set of STSs a collection of overlapping DNA fragments from a single chromosome or the entire genome is required.
- To do this, the genome is first broken up into fragments.
- The fragments are then replicated up to 10 times in bacterial cells to create a library of DNA clones.
- The polymerase chain reaction (PCR)? is then used to determine which fragments contain STSs. Special primers? are designed to bind either side of the STS to ensure that only that part of the DNA is copied.
- If two DNA fragments are found to contain the same STS then they must represent overlapping parts of the genome.
- If one DNA fragment contains two different STSs then those two STSs must be near to each other in the genome.